 ASPNetWorld

Version 2026.2.2 arrived on 16 September with a fix for a very specific macOS freeze that could hit Rider 26.2.2 — the kind of detail that matters when an IDE is your daily workshop. That same update also introduced an AI Agent Setup widget in the status bar and taught dotCover to measure unit test coverage for TUnit tests, but the freeze fix alone is what makes this build feel safer to install.
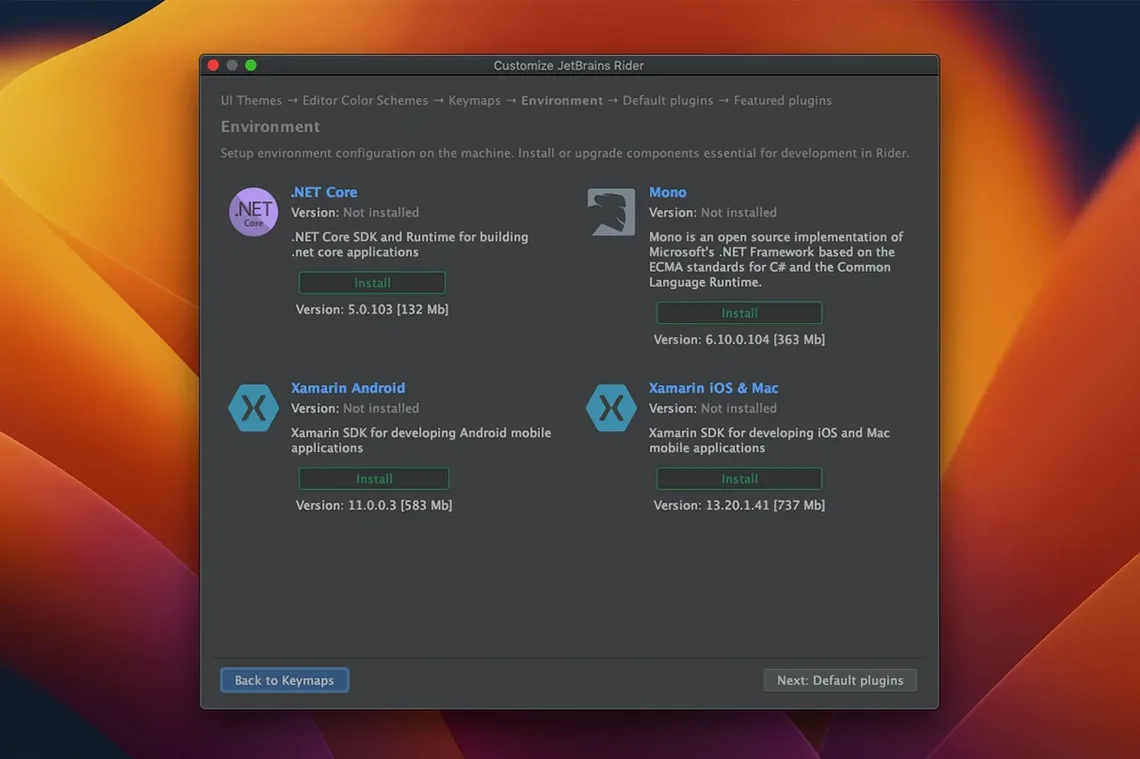
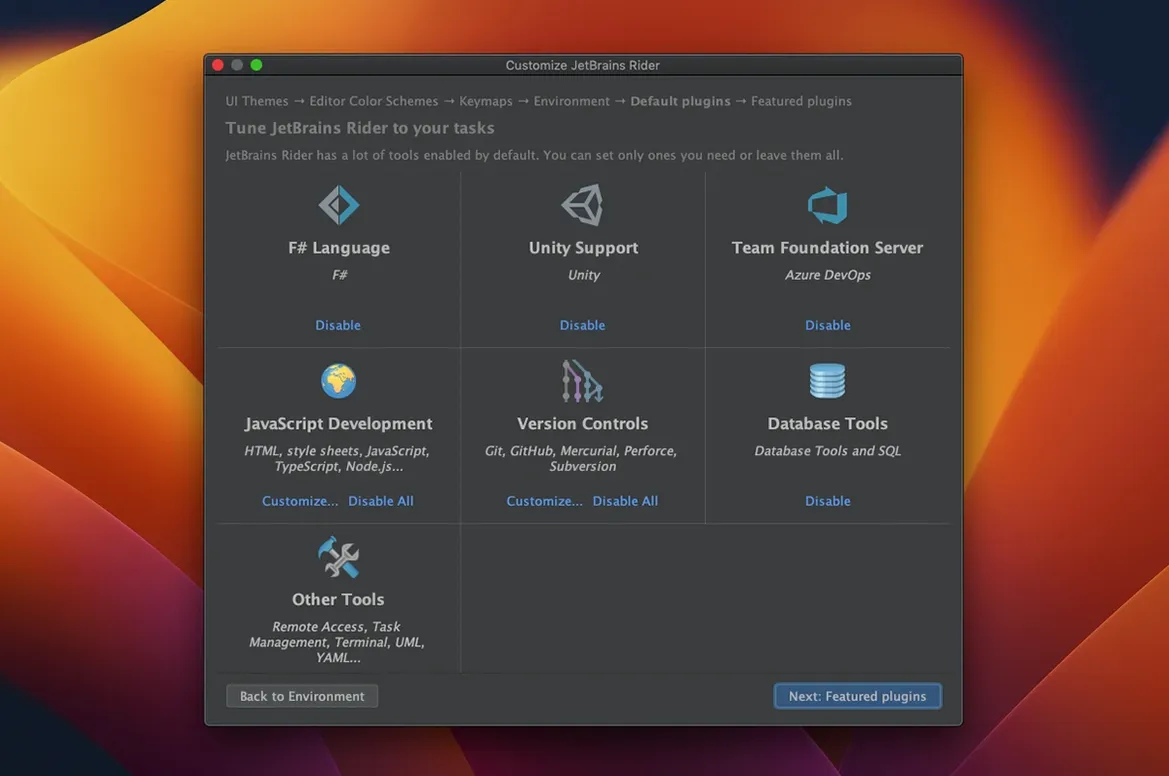
Rider is a cross‑platform .NET IDE that lives on Windows, macOS, and Linux without favouring one over the others. It handles .NET applications, services, and libraries, and it does the same for the web stack you probably use alongside them: JavaScript, TypeScript, HTML, CSS, and Sass. If your work leans toward mobile, Xamarin support is built in, and plugins open the door to F#, Unity projects, and whatever version‑control system you have wired up.
People ask about the toolchest before they commit disk space, so here is the short version. Rider ships with a full code editor, on‑the‑fly code inspections, refactorings, testing tools, a built‑in debugger, and a decompiler. You can install it through the Toolbox App, grab a direct download from the JetBrains website, or pull it in from inside another IDE. The package includes both install and activation instructions, so there is no separate hunt for a licence file.
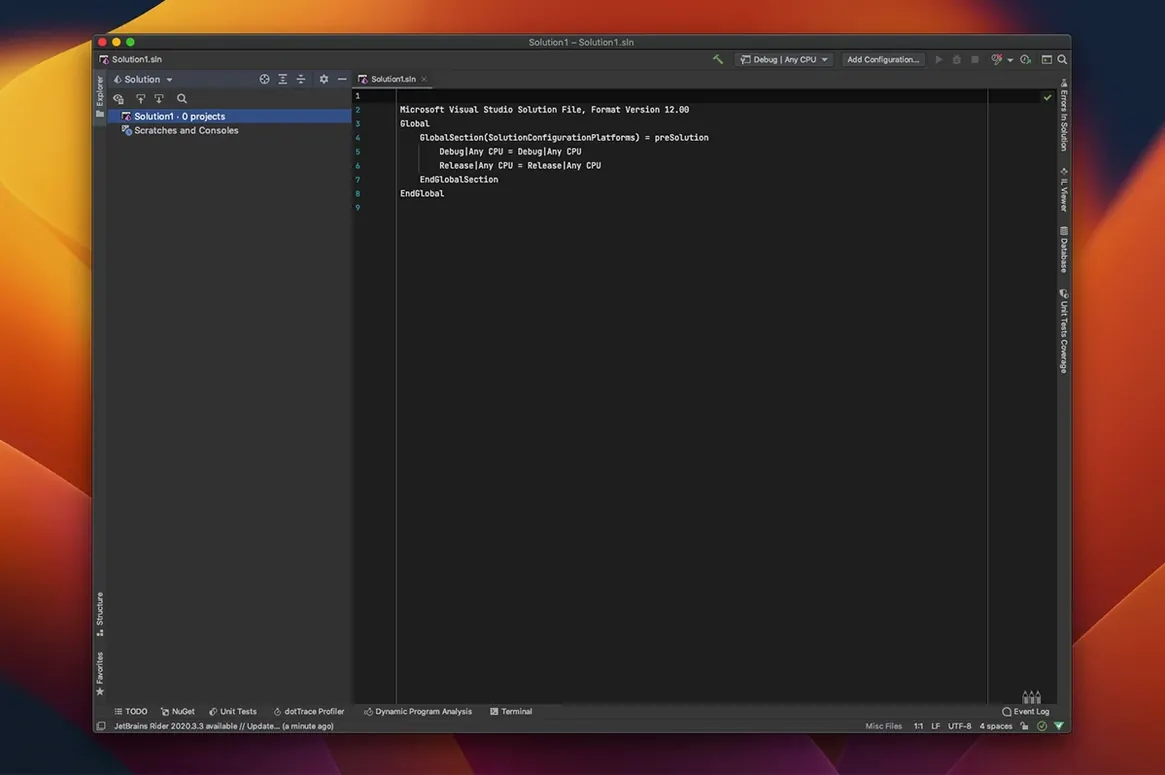
In the first few days, the single most useful thing you can do is let Rider learn your solution. Open a project, wait for the initial indexing and cache-building pass to finish — the activity indicator in the status bar tells you when it is done — and then take three minutes to walk through the Settings dialog. Not to change everything, but to notice what is already there. The keyboard shortcut scheme can be switched to a ReSharper mapping, a Visual Studio mapping, or one of the macOS-friendly presets, and that choice alone removes a lot of early friction if you are coming from another editor.
The AI Agent Setup widget that appeared in the 2026.2.2 status bar is worth a glance even if you do not plan to use it heavily. In its default state it sits quietly, but opening it once lets you set a preference for how much feedback Agent hooks give after code changes. Setting it to “targeted” rather than “verbose” keeps the inline suggestions brief, which feels right during the first week while you are still forming muscle memory for Rider’s own inspections.
Another early habit that pays off: pin the Unit Test Explorer and the NuGet tool window to the right-hand dock. Rider’s test runner discovers NUnit, xUnit, MSTest, and — thanks to the latest dotCover update — TUnit tests without extra configuration, but having the explorer visible means you see the green bar turn red the moment something breaks, rather than finding out from a colleague ten minutes later.
Pinpoint a 500 error with a breakpoint instead of Console.WriteLine
Imagine a controller action that returns a 500 under a specific combination of query parameters. You could scatter Console.WriteLine calls and recompile, but the built-in debugger makes the path shorter. Place a breakpoint on the first line of the action, then hit the green play button on the toolbar — Rider compiles the project, starts the Kestrel server, and attaches the debugger in one step. When the breakpoint hits, the Variables pane shows the request context, route values, and any injected services.
The Locals and Autos windows give you the current state, but the real time-saver is inline debugging: hover over any variable in the editor and Rider shows its value right there, with little arrows to drill into nested objects. If the exception is thrown deeper in a library you do not have source for, the built-in decompiler steps in and shows a readable reconstruction of the code, so the call stack never goes dark. Once you spot the rogue null reference, you can use the refactoring menu — Control+T on a Mac — to introduce a null guard, and Rider will offer to update all call sites.
After the fix, run the test suite. The Unit Test Explorer already has the affected test class listed; click the “run covered tests” button and dotCover highlights which lines your test touches. With TUnit now supported in the coverage reports, you see the same green-and-red gutter marks regardless of which test framework the team picked. The whole cycle — breakpoint, inspect, decompile, fix, refactor, test — happens without leaving the IDE.
How Rider sits alongside other apps and macOS features
Rider plays well with the Mac ecosystem in ways that matter during a long working day. It registers itself as a handler for .sln and .csproj files, so double-clicking a solution in Finder opens it directly. The macOS share sheet is not where you expect an IDE to appear, but Rider shows up when you select a snippet of text in another app — useful for flinging a stack trace from Slack or a browser into a scratch file without copy‑pasting by hand.
On the terminal side, Rider’s built-in terminal passes through to your default shell, which means your Homebrew-installed .NET SDK and any global tools you rely on are right there. If you use the Toolbox App to manage multiple JetBrains products, Rider shares the same proxy and authentication settings as IntelliJ IDEA or WebStorm, so configuring a corporate proxy once cascades across the suite.
Version control integration is deep without being showy. The Commit tool window shows diffs side by side, and the local history feature — often overlooked — acts like a per‑file Time Machine that records changes even before you commit. If you break something at 3 p.m., you can diff against the state at 2:55, even if no Git commit occurred. That feature alone has saved more afternoons than I can count.
The decompiler works with macOS’s Quick Look in an indirect but helpful way: you cannot Quick Look a .dll in Finder, but drag that same file into Rider and the decompiler reconstructs namespaces and class outlines instantly. For exploring a third‑party package before you add it via NuGet, it is faster than opening a browser.
Launches in seconds on Apple Silicon and a recent macOS freeze is fixed
On an Apple Silicon Mac, Rider launches in a handful of seconds after the first indexing pass. The 2026.2.2 update specifically addressed a freeze on macOS 26.2.2, and in a week of heavy use — solution rebuilds, multiple debug sessions, three open solutions at once — I have not seen the beach ball. Memory pressure sits higher than a lightweight text editor, naturally, but the JVM-based runtime keeps things predictable. With a medium‑sized ASP.NET Core solution and a Unity project open side by side, Rider’s process hovers around 1.8 GB of RAM, which leaves room for a browser, Slack, and a design tool without the system reaching for swap.
Code inspections run on the fly and the typing lag people sometimes associate with heavy static analysis does not materialise here. Rider defers deeper solution-wide analysis to idle moments, so when you are hammering out new code the editor stays responsive. Build times depend on your project, not the IDE, but the build tool window shows a timeline that makes it easy to spot whether the bottleneck is a particular project or a post‑build step you forgot about.
Rider’s plugin architecture means you can add support for the Rider crack mac workflow if you ever need to inspect how a third‑party assembly is structured, though the decompiler handles most of that without plugins. The IDE’s own plugin manager updates extensions silently, and a restart is rarely required — most changes apply the moment you toggle them.
Version 2026.2.2 is a maintenance release with a handful of sharp improvements. The centrepiece is a fix for a freeze that affected Rider on macOS 26.2.2, so the IDE should now stay responsive where it previously locked up.
- Added the AI Agent Setup widget in the bottom‑right status bar, giving you a quicker on‑ramp to agent features.
- Agent hooks now return more targeted feedback after code changes, helping you judge a suggestion without leaving the editor.
- dotCover integration can now measure coverage for unit tests written with TUnit, widening the testing frameworks you can profile.
- macOS 11 or later
- Intel or Apple Silicon Mac
Questions from the class 0
Sign in or join the class to ask a question.
Nobody has asked anything yet. If you have used it on a real job, say what the file did.
Also on the Mac Apps shelf
The whole Mac Apps shelf Rhino
Models precise 3D forms for design and manufacturing.
Rhino
Models precise 3D forms for design and manufacturing.
 RightFont
Manages and previews fonts directly from the menu bar.
RightFont
Manages and previews fonts directly from the menu bar.
 Remove-It
Uninstalls apps and removes their leftover files.
Remove-It
Uninstalls apps and removes their leftover files.
 Raycast Pro
Launches apps and commands from a keyboard palette.
Raycast Pro
Launches apps and commands from a keyboard palette.
 RAR Extractor
Previews and extracts compressed archive contents.
RAR Extractor
Previews and extracts compressed archive contents.
 Screen Studio
Records your screen while automatically smoothing cursor movement and trimming silence.
Screen Studio
Records your screen while automatically smoothing cursor movement and trimming silence.
 RAR Extractor - unzip
Extracts files from compressed archives like RAR and ZIP.
RAR Extractor - unzip
Extracts files from compressed archives like RAR and ZIP.
 ScreenFlow
Captures and edits screen recordings, then turns your clicks and taps into animated callouts.
ScreenFlow
Captures and edits screen recordings, then turns your clicks and taps into animated callouts.