 ASPNetWorld
Version 7.5 introduces an entirely new Astronomy item, bringing a panel of observing forecasts right into your menu bar. You can now glance at predictions for seeing, transparency, and cloud cover without leaving your work—useful if you’re planning an evening with a telescope and don’t want to open a dedicated app.
macOS version and Apple silicon support
The official requirement is macOS 11 (Big Sur) or later, and the app is a native build for both Apple silicon and Intel 64-bit Macs. So if you’ve made the jump to an M-series chip or you’re still on a capable Intel machine running an up-to-date system, you’re covered. The installer includes an optional helper component that unlocks temperature and fan speed readings; you’ll be prompted to install it on first launch, and it’s the bit that talks directly to the sensors.
A tour of what you get
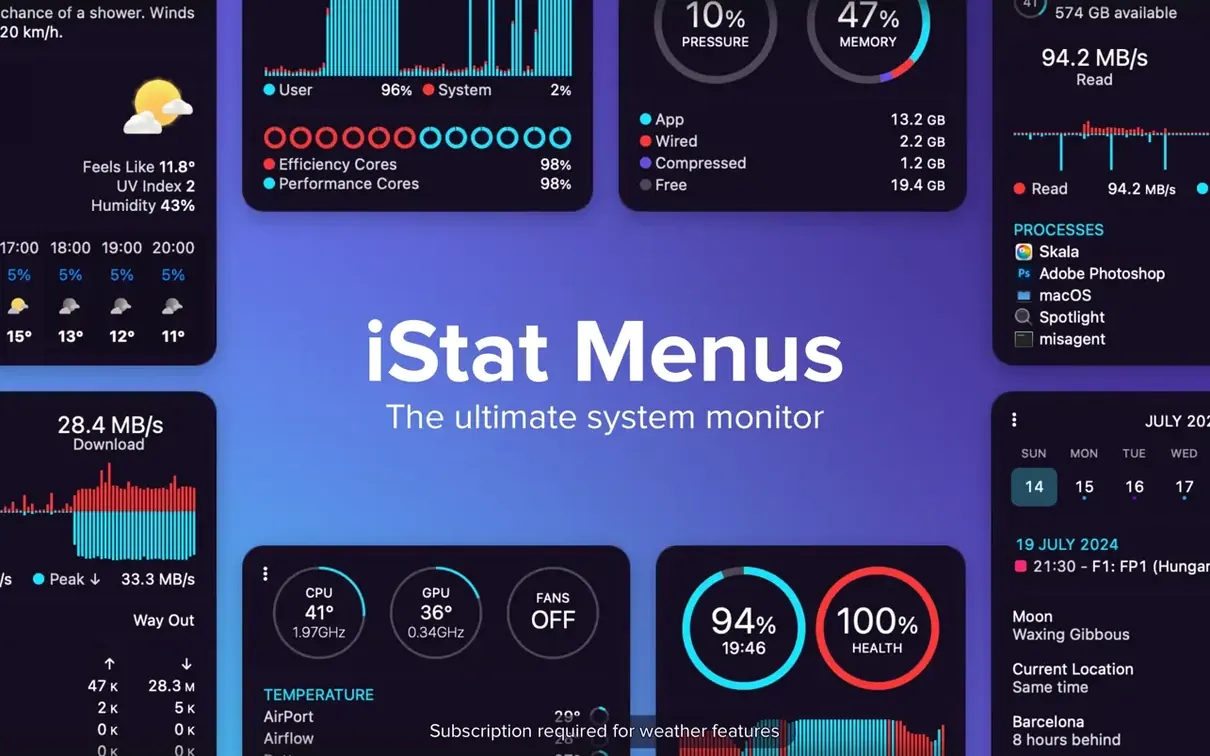
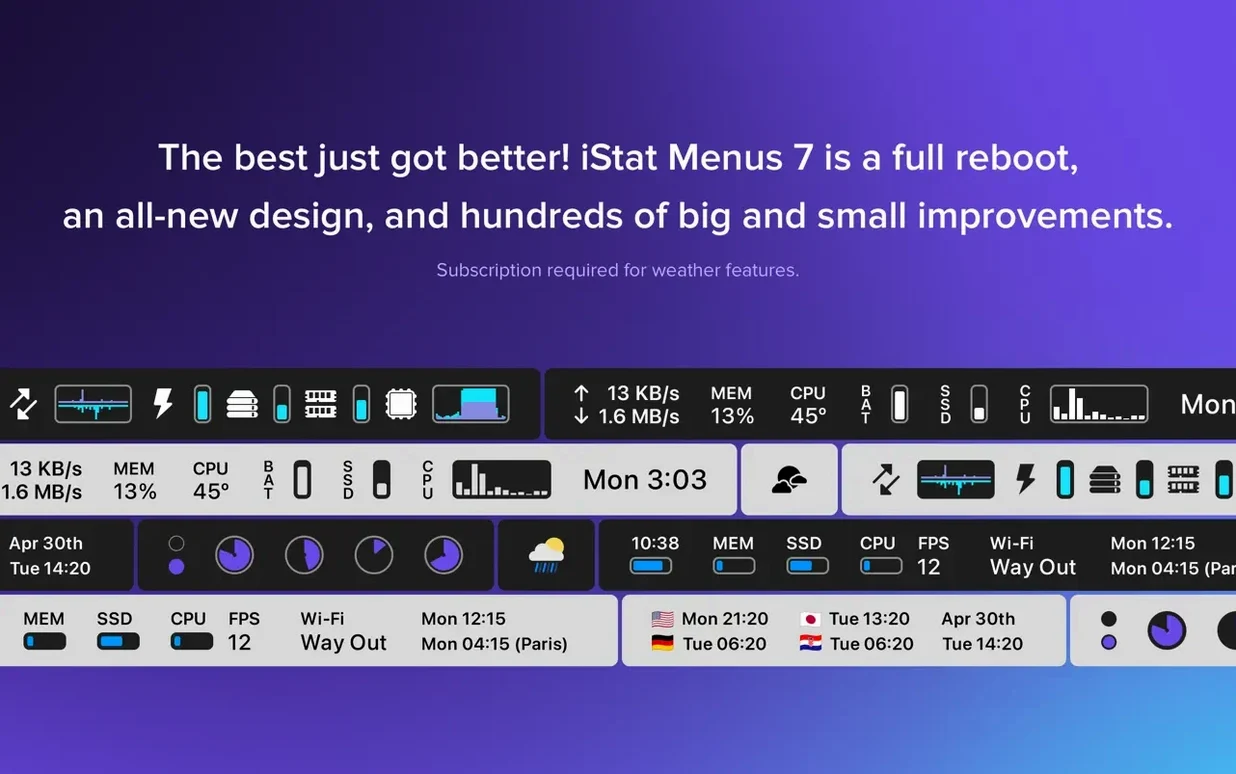
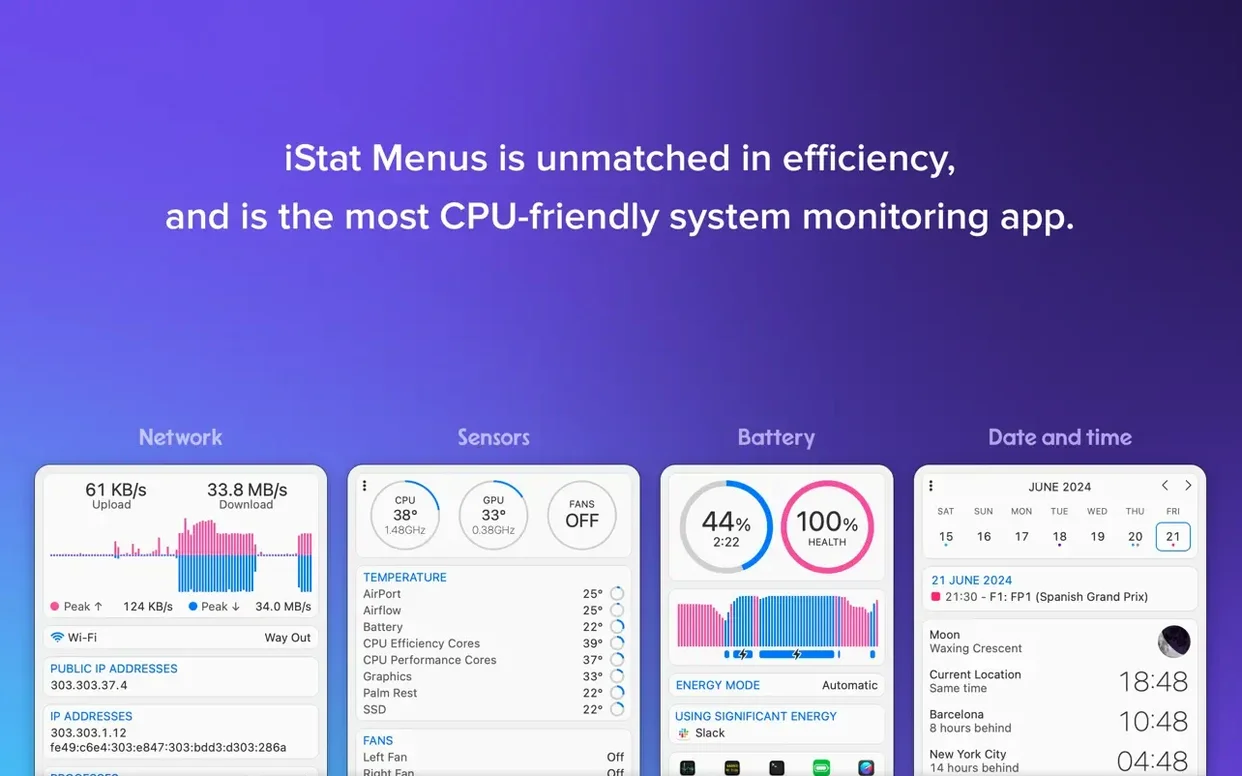
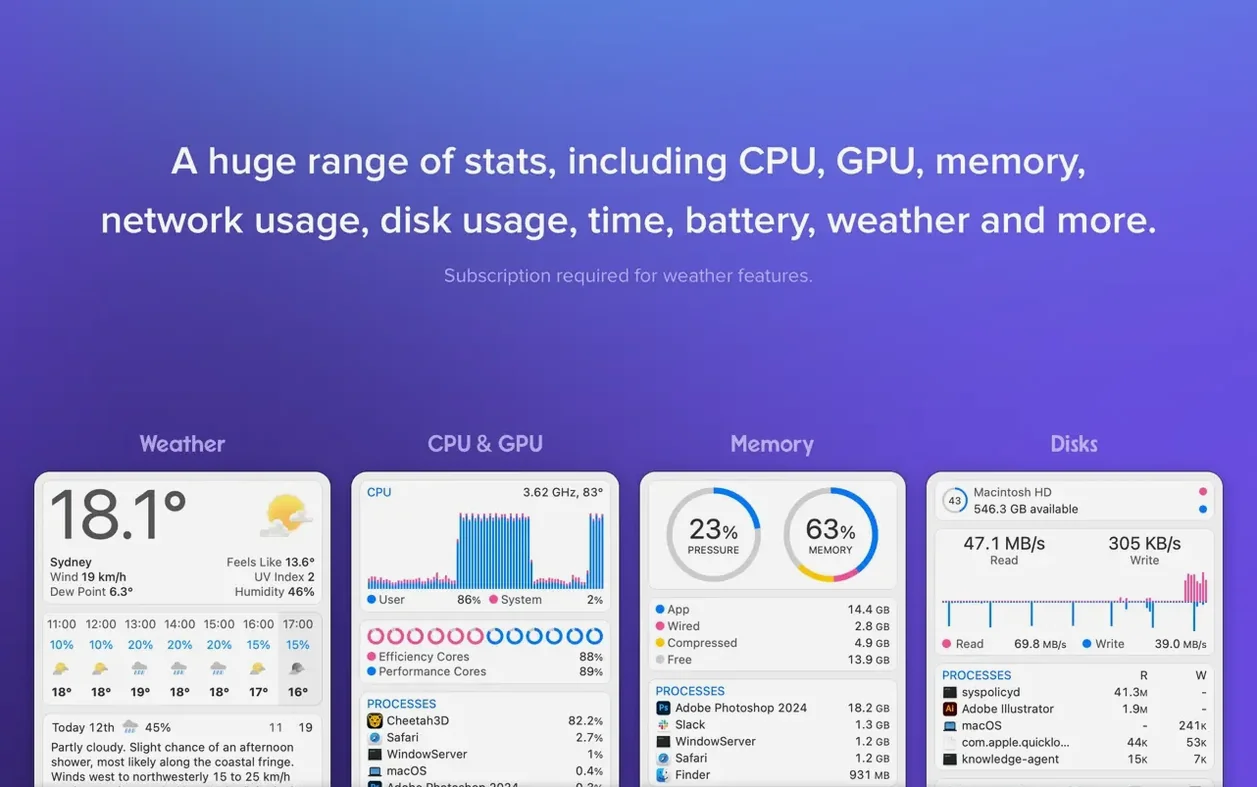
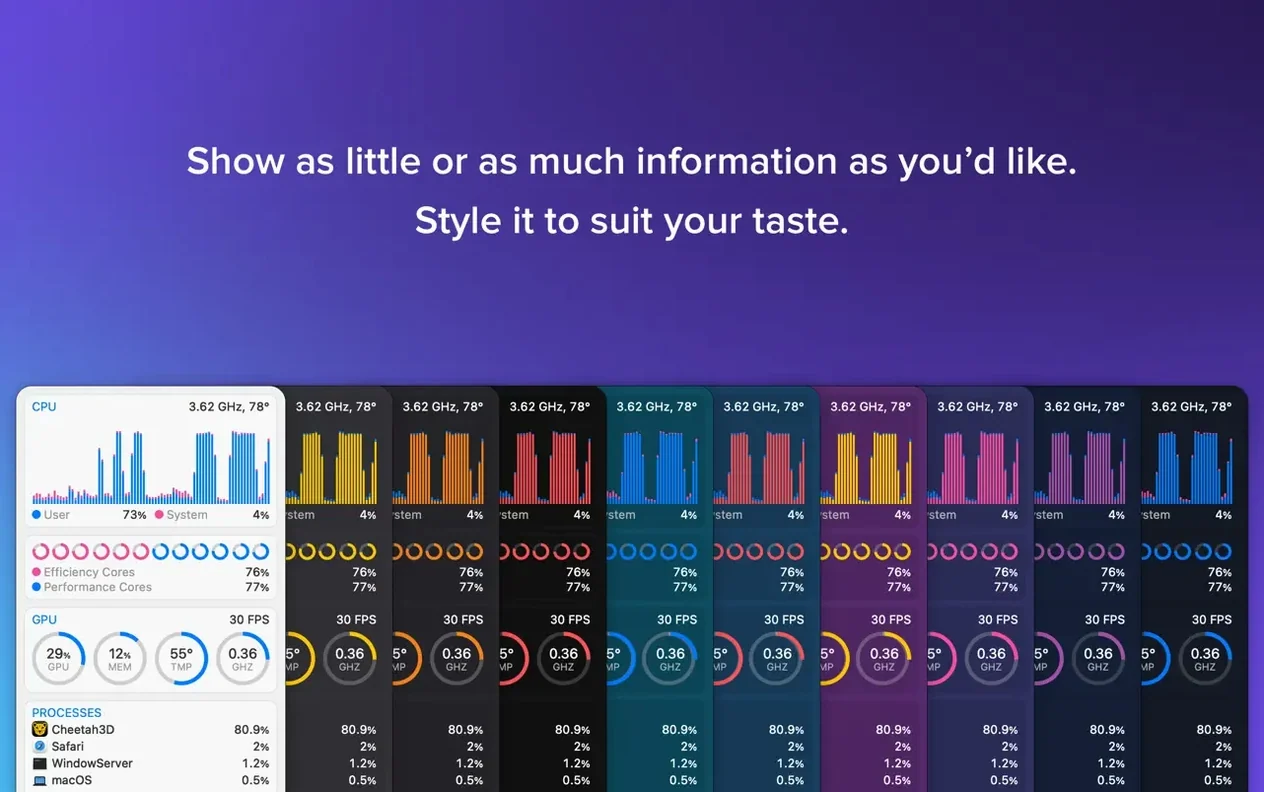
Once installed, iStat Menus lives in your menu bar as a set of fully configurable dropdowns. The memory module, for example, can be set to a compact pie chart or a line graph, and it lists the applications currently using memory most actively. The disk section shows usage, read and write activity, and S.M.A.R.T. status monitoring for early warnings of drive trouble. Network dropdowns display current bandwidth charts for your connection, plus a per-application breakdown so you can spot exactly which service is hogging the upload. All the panels share a calm, information-dense design that rewards a passing glance rather than demanding your full attention.
Once you have the menu bar set looking roughly how you want it, resist the temptation to dive straight into tweaking every threshold. The best approach I’ve seen in the classroom is to live with the default settings for two or three days. Let the numbers wash over you while you work normally. That way you build a mental picture of what “normal” actually looks like on your machine — the idle CPU temperature when you’ve only got a browser open, the memory pressure colour during a heavy compile, the network spike when a cloud backup kicks in. Without that baseline, you’re adjusting alerts to numbers that don’t mean much yet.
One small change worth making early is pinning the battery cycle count and health percentage into the battery dropdown. It’s tucked away in the item’s settings under the secondary stats, and it turns a simple percentage readout into a proper battery-age diary. Pair that with a gentle low-battery notification — say fifteen percent — and you’ll catch the battery before it catches you out during a long meeting away from a charger.
If you installed the helper component for sensor data, open the sensors dropdown on day one, scroll through the list, and untick any readings you genuinely don’t need. On a MacBook Pro you might see a dozen temperature probes. Keeping only the CPU proximity, GPU die, and fan speeds stops the menu from feeling like an aircraft cockpit. You can always re-enable a probe later if you’re diagnosing a hotspot.
Weather and astronomy forecast in the menu bar
Imagine a Tuesday morning. You sit down with coffee, and the first thing you notice in the menu bar is the weather icon showing a light rain symbol. A click reveals the weekly forecast: clearing by mid-afternoon. The astronomy pane, if you added it, confirms good transparency for the evening, so you quietly plan to set up the telescope later — all without opening a browser tab.
You launch your usual stack: a code editor, a dozen Safari tabs, Slack, and a Docker container that chews RAM for breakfast. Half an hour in, the memory dropdown’s pie chart has shifted from green to amber. You open it and see the top-five list: Docker is sitting at nine gigabytes, and a single browser tab — a poorly behaved web app — is holding another two. The pressure graph line is climbing. Rather than guessing, you quit the tab and restart the container. The pie drifts back to green within seconds. The whole check took less than ten seconds and never pulled you out of your editor.
Later, you’re uploading a batch of raw photos to cloud storage. The network dropdown shows a solid outbound stream at eleven megabytes per second, saturating your upstream. You click through to the per-app listing and confirm it’s the sync client, not a background process you’d forgotten about. You decide to let it run; the estimate in the dropdown tells you it’ll finish in eight minutes, so you grab a refill.
By late afternoon the fans have spun up audibly. A glance at the sensors panel shows the CPU proximity sitting at eighty-nine degrees with the left fan at four-thousand RPM. You’re compiling a large project, so it’s expected, but you make a mental note to clean the desk area so the intake grille isn’t half-blocked by paperwork. The data doesn’t demand action — it just gives context to the noise.
Overfilling the menu bar pushes out the clock
The most common slip I see is adding too many items to the menu bar on day one and then finding half the clock gets pushed off screen by a crowded bar. iStat Menus is wonderfully granular, but that granularity works against you if you enable every single graph, every single label, and the full date-and-time panel alongside the system clock. Start with three or four items that answer your most frequent questions — “how hot is it?”, “how much RAM is free?”, “how fast is the network?” — and add more only when you genuinely miss the information.
Another mistake is treating every amber or red reading as an alarm. Memory pressure in the yellow zone during a heavy task is perfectly normal on a modern Mac; the operating system is designed to compress and swap aggressively before you feel it. If the machine isn’t stuttering, the colour alone isn’t a problem. The same goes for CPU temperature. A brief spike to ninety degrees while exporting video is within design spec. Use the readings to spot trends over days, not to panic at individual peaks.
Some users download an iStat Menus crack or look for an iStat Menus torrent to try before committing, and the helper component that reads sensors and fans can work well in those versions if you take a moment to allow the extension in System Settings → Privacy & Security — it's the same code-signing dance macOS asks of any kernel-level tool, much like a backstage pass that just needs a quick nod from the door staff. Once that's sorted, you'll have the full sensor suite and fan control ready to go.
Lastly, forgetting to check the per-app network breakdown exists. Many people stare at the total throughput graph wondering what’s eating bandwidth, without realising the dropdown has a second tab listing each application’s current usage. It’s a single click away and it solves more mysteries than any other view in the app.
It complements Activity Monitor as a live dashboard
iStat Menus doesn’t try to replace Activity Monitor; it complements it. Activity Monitor is a diagnostic tool you open when something feels wrong. iStat Menus is a dashboard you glance at while everything is working, which is precisely when small problems first appear. I keep both in mind: if the menu bar shows sustained high CPU from a process I don’t recognise, I open Activity Monitor for the deeper dive, the full process tree, and the quit-or-sample decision.
The weather and astronomy panels integrate naturally with macOS Notification Centre widgets, but the menu bar approach is faster. Rather than swiping left and reading a widget stack, you click the temperature icon and see the forecast in a single dropdown. The astronomy seeing forecast is especially handy if you already use apps like Stellarium or SkySafari for planning; iStat Menus gives you the atmospheric conditions at a glance, and you switch to the dedicated planetarium app only when the conditions justify it.
Fan control is where the app reaches beyond macOS’s built-in options. Apple’s firmware fan curves prioritise silence over cooling, which is sensible for most people, but if you’re running sustained loads — rendering, machine learning training, large compiles — you can set a custom rule that ramps fans earlier and keeps the chassis cooler. The sensors panel reports current and voltage alongside temperature, so if you’re using a third-party utility like AlDente for charge limiting, you can cross-check the charging wattage in iStat Menus and confirm your limit is actually being respected.
For anyone who’s searched for a way to download iStat Menus 6 on an older Mac, version 7.50 covers the same ground and more on any machine running Big Sur or later. The older version still circulates, but the current build’s astronomy addition and the refined sensor support on Apple silicon make it the one worth running if your system meets the requirement. If your daily workflow involves a mix of creative tools, development environments, and cloud sync services, iStat Menus sits quietly between them all — a thin layer of awareness that stops you having to open five different utilities to answer the question “what’s my Mac doing right now?”.
Version 7.5 adds a new Astronomy item with observing forecasts.
- New Astronomy dropdown for the menu bar.
- Forecasts for seeing, transparency, cloud cover, and other observing conditions.
- macOS 11 (Big Sur) or later
- Apple silicon or Intel 64-bit Mac
- Optional helper component for temperature and fan speed readings
Questions I keep hearing
Does iStat Menus support Apple silicon natively?
Yes, version 7.50 is a universal binary that runs natively on both Apple silicon and Intel 64-bit Macs.
Questions from the class 0
Sign in or join the class to ask a question.
Nobody has asked anything yet. If you have used it on a real job, say what the file did.
Also on the Mac Apps shelf
The whole Mac Apps shelf iShot Pro-ScreenShot Recording
Captures screenshots, scrolling pages and screen recordings with a floating toolbar.
iShot Pro-ScreenShot Recording
Captures screenshots, scrolling pages and screen recordings with a floating toolbar.
 Infuse Pro
Plays almost any video file, including high-bitrate MKVs, direct to your screen or receiver.
Infuse Pro
Plays almost any video file, including high-bitrate MKVs, direct to your screen or receiver.
 iMazing
Creates local, browsable backups of an iPhone or iPad and extracts specific files from them.
iMazing
Creates local, browsable backups of an iPhone or iPad and extracts specific files from them.
 Imagenomic Portraiture
Smooths skin and removes blemishes across a whole shoot while preserving natural texture.
Imagenomic Portraiture
Smooths skin and removes blemishes across a whole shoot while preserving natural texture.
 JPEGmini Pro
Shrinks JPEG file sizes without visibly changing the photo.
JPEGmini Pro
Shrinks JPEG file sizes without visibly changing the photo.
 Jump Desktop
Lets you control another Mac or PC from your current screen and drag files between them.
Jump Desktop
Lets you control another Mac or PC from your current screen and drag files between them.
 Imagenomic Plugin Suite
Bundles three plugins that retouch skin, reduce noise and add film grain inside your image editor.
Imagenomic Plugin Suite
Bundles three plugins that retouch skin, reduce noise and add film grain inside your image editor.
 iExplorer
Transfers music, messages and files between an iPhone and a Mac without using iTunes or iCloud.
iExplorer
Transfers music, messages and files between an iPhone and a Mac without using iTunes or iCloud.